

The Fed's Reaction Function & Rate Cuts
What is needed to confirm the market's expectation for rate cuts this year?

I would like to discuss the current market expectation of at least two rate cuts by the Fed in the second half of this year (CME Group: December 4,6% vs 5,1% May). While these expectations are certainly possible, it is important to note that the Fed has just signaled that it was close to pausing its rate hike cycle, with the last rate hike occurring in May 2023. As such, it might be too soon to expect rate cuts in 2H23.
There are two possible scenarios that could confirm the market's expectation of rate cuts. The first scenario is a recession. If the US economy were to experience a recession in the near future (like the 2s10s are currently suggesting), the Fed would likely respond by cutting rates to stimulate economic growth. In formal terms, a recession produces a downward shift in the aggregate demand curve, which would lead to lower output and higher unemployment in the short run - which in the future reduces wages and also the ability of the private sector to pass on prices.
The second scenario is a change in the parameters of the Fed's reaction function - which describes how the central bank responds (in terms of policy) to changes in economic conditions. If the Fed were to change its reaction function in a way that places more emphasis on guaranteeing economic stability or maximum employment, it could lead to a lower policy rate and the possibility of rate cuts. This could be reflected in a shift in the Taylor rule, which is a widely-used formula that describes the appropriate level of the policy rate based on inflation and output. Let’s make a (soft) deep dive here.
The Recession Way
During a recession, the Fed may choose to cut rates even if inflation is high. While it is true that the Fed's primary goal is to maintain price stability and control inflation, its mandate also includes promoting maximum employment and economic growth.
During a recession, unemployment tends to rise and economic growth slows down. However, considering the lagged effects of monetary policy, the Fed may choose to adjust its policy in the short term, reflecting pressure from society (population, Congress, US government, and markets), while waiting for the expected effects on medium-term inflation.
Inflation targeting is not an absolute policy, but rather a flexible framework that allows the Fed to adjust its policy stance based on changing economic conditions. Moreover, it is important to note that the Fed has a long-term view of inflation, rather than just looking at short-term fluctuations. Therefore, cutting interest rates during a recession may not necessarily conflict with the Fed's goal of maintaining price stability.
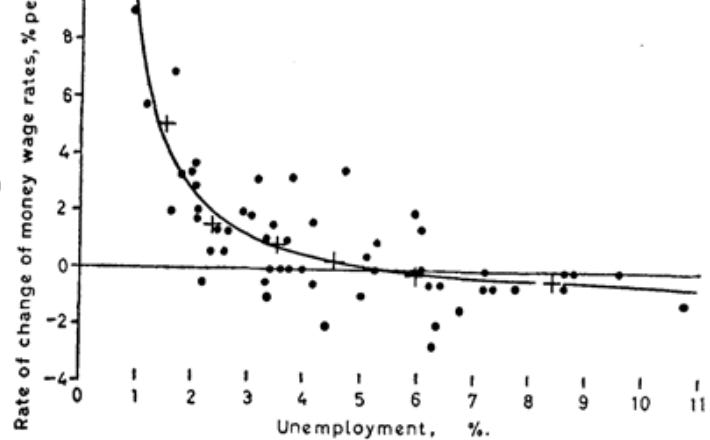
To understand how a recession can lead to a rate cut, we can use the Phillips curve and the Taylor rule. The Phillips curve describes the inverse relationship between unemployment and inflation, while the Taylor rule describes the appropriate level of the policy rate based on inflation and output.
The Phillips curve can be expressed as follows:
where π^e represents expected inflation, π* represents the target inflation rate, µ represents unemployment, µ* represents the natural rate of unemployment, and α is the slope of the Phillips curve (PC). So, PC suggests that there is a trade-off between inflation and unemployment.
In the mid of a recession, µ may exceed µ* and given the sensitivity of that economy's price formation process to this gap (α), expected inflation may be lower, opening up room for policy changes.
On the other hand, the Taylor rule can be expressed as follows:
where i represents the nominal interest rate, r* represents the natural real interest rate, πe represents expected inflation, π* represents the target inflation rate, y represents output, and y* represents potential output. It's important to note that ß1 refers to the central bank's sensitivity to the distance between inflation and its target (how hawkish or dovish it can be in relation to de-anchoring), while ß2 shows how sensitive it is in relation to the output gap and possibly unemployment.
During a recession, when output is below potential and unemployment is high, the Taylor rule would suggest that the Fed should lower the policy rate given that the numbers inside the parentheses may turn out to be negative.
The Reaction Function Way
This is exactly where it's worth talking about the reaction function. It's difficult to point the real values of ß in the Taylor rule, usually estimated with past data. On the other hand, there's no guarantee that the Central Bank, in this case the Fed, will continue to have the same sensitivity to inflation and the output gap.
In this sense, looking at the current situation, we can have a situation where the current FOMC places more weight on a negative output gap, given the recession, than on a deanchoring of inflation expectations in relation to the target, thus changing the values of ß and producing a Taylor rule that suggests a lower interest rate (i).
This change could occur due to the alteration of the committee's composition - as indeed happened in 2023 - or even due to external pressure. In the last 10 years, we have seen a Fed that opted for a looser policy and knows that there is a whole economy that has been developed on that pillar, with some short-term pains already appearing, such as with small banks. The big problem is that there is doubt about the current parameter of the Phillips curve, "α", which may show a lower relationship between unemployment and inflation dynamics.
If the Fed changes its reaction function, different from what history prescribes and what would be necessary given the high inflation, we will likely have high inflation for longer, with changes in expectations along the yield curve.
The paper "Nonlinear Taylor Rules and Asymmetric Preferences in Central Banking: Evidence from the United Kingdom and the United States" investigates the Taylor rule. A symmetric rule implies that the central bank responds the same way to inflation deviations above and below the target, while an asymmetric rule suggests that the central bank is more concerned with deviations above the target than below.
The authors examine this issue by estimating nonlinear Taylor rules using data from the United Kingdom and the United States. They find evidence of asymmetry in the response of the central banks to inflation deviations, with the central banks being more aggressive in raising interest rates in response to inflation above the target than in lowering rates in response to inflation below the target. However, they do not find evidence of asymmetry in the response to the output gap.
The paper "The Asymmetry of U.S. Monetary Policy: Evidence from a Threshold Taylor Rule with Time-Varying Threshold Values" investigates whether U.S. monetary policy is asymmetric by analyzing data from 1955 to 2015 using a forward-looking threshold Taylor rule. The researchers modify the threshold model to capture potential heterogeneity in regime shift mechanisms under different economic conditions. The authors find evidence that U.S. monetary policy is asymmetric in expansion and recession periods.
Specifically, the monetary authority tends to have a stronger response to the output gap during recession periods while having a weaker response to the inflation gap. The targeted unemployment rate of monetary authorities also shows significant time-varying properties, suggesting that policymakers may adjust their reference point for the unemployment rate to reflect their attitude towards the general economy. The threshold value, interpreted as the targeted unemployment rate of monetary authorities, exhibits significant time-varying properties, indicating that policymakers may adjust their reference point for the unemployment rate accordingly to reflect their attitude on the health of the general economy.
Historical mistakes and Bob Lucas
One historical mistake in rate cuts during a recession with high inflation was the Fed's response to the 1970s and early 1980s stagflation period. During this time, the U.S. economy experienced both high inflation and high unemployment, which presented a significant challenge for the Fed's monetary policy.
In the early 1970s, the Fed responded to the recession by cutting interest rates and implementing expansionary monetary policy to stimulate the economy. However, these actions also contributed to the rise of inflation, which continued to climb throughout the decade.
One of the key mistakes made by the Fed during this period was the failure to anchor inflation expectations. The Fed's inconsistent response to inflation and recession led to uncertainty among consumers and businesses, which contributed to volatile swings in inflation and economic activity.
The paper "Some International Evidence on Output-Inflation Tradeoffs" by Robert Lucas, published in 1973, examines the relationship between inflation and output in different countries during the 1960s. Lucas argues that the prevailing economic theory at the time, which claimed that there was a linear relationship between inflation and unemployment, was unable to adequately explain the observed relationship between inflation and output.
Lucas proposes an alternative approach based on a microeconomic theory of aggregate supply and demand, in which inflation is influenced by the expectations of economic agents. He argues that the relationship between inflation and output is not linear, but depends on the level of inflation expectations of economic agents. To test his theory, Lucas uses data from various countries, including the United States, Japan, the United Kingdom, and Germany.
Lucas's paper had a significant impact on the field of macroeconomics and helped inaugurate a new era of research based on dynamic general equilibrium models. His theory of rational expectations and his approach of aggregate supply and demand became central to modern macroeconomics.